The Creative Gaming: Space Pirates case explores the marketing challenges faced by Creative Gaming, a mobile game company whose hit title, Space Pirates, achieved rapid early success. To maintain player engagement and drive revenue, the company launched a paid campaign expansion called Zalon, priced at $14.99. However, only 5.75% of active users purchased the campaign, raising concerns about pricing and marketing effectiveness. CMO Mi Haruki tasked the analytics team with developing a data-driven targeting strategy to increase campaign adoption without changing the price.
Building on previous “propensity-to-buy” work, the new assignment focuses on uplift modeling—an approach that estimates the incremental impact of marketing interventions by distinguishing between users who buy because of an ad and those who would have purchased anyway. Using experimental data from 60,000 players—half exposed to ads (cg_ad_random) and half in the control group (cg_organic_control)—the objective is to predict which users show the highest causal uplift in conversion probability.
The project involves training multiple machine learning models—logistic regression, neural networks, random forests, and XGBoost—to compare uplift performance with traditional propensity models. The analysis will also determine the optimal share of customers to target in order to maximize incremental profit, not just response rate.
Ultimately, this case highlights how uplift modeling enables Creative Gaming to allocate marketing resources efficiently, improving ROI by focusing only on users whose behavior can be positively influenced by advertising.
Data
Description
import pandas as pdimport pyrsm as rsmrsm.md("cg_ad_treatment_description.md")
Game telemetry dataset used for the Creative Gaming: Propensity-to-Buy Modeling case
Feature descriptions
converted: Purchased the Zalon campain (“yes” or “no”)
GameLevel: Highest level of game achieved by the user
NumGameDays: Number of days user played the game in last month (with or without network connection)
NumGameDays4Plus: Number of days user played the game in last month with 4 or more total users (this implies using a network connection)
NumInGameMessagesSent: Number of in-game messages sent to friends
NumFriends: Number of friends to which the user is connected (necessary to crew together in multiplayer mode)
NumFriendRequestIgnored: Number of friend requests this user has not replied to since game inception
NumSpaceHeroBadges: Number of “Space Hero” badges, the highest distinction for gameplay in Space Pirates
AcquiredSpaceship: Flag if the user owns a spaceship, i.e., does not have to crew on another user’s or NPC’s space ship (“no” or “yes”)
AcquiredIonWeapon: Flag if the user owns the powerful “ion weapon” (“no” or “yes”)
TimesLostSpaceship: The number of times the user destroyed his/her spaceship during gameplay. Spaceships need to be re-acquired if destroyed.
TimesKilled: Number of times the user was killed during gameplay
TimesCaptain: Number of times in last month that the user played in the role of a captain
TimesNavigator: Number of times in last month that the user played in the role of a navigator
PurchasedCoinPackSmall: Flag if the user purchased a small pack of Zathium in last month (“no” or “yes”)
PurchasedCoinPackLarge: Flag if the user purchased a large pack of Zathium in last month (“no” or “yes”)
NumAdsClicked: Number of in-app ads the user has clicked on
DaysUser: Number of days since user established a user ID with Creative Gaming (for Space Pirates or previous games)
UserConsole: Flag if the user plays Creative Gaming games on a console (“no” or “yes”)
UserHasOldOS: Flag if the user has iOS version 10 or earlier (“no” or “yes”)
rnd_30k: Dummy variable that randomly selects 30K customers (1) and the remaining 90K (0)
Data Preprocessing for Uplift Modeling
Before building the uplift model, several preprocessing steps were performed to construct a dataset suitable for causal inference.
The goal was to create a unified structure that allows direct comparison between users exposed to the advertisement (treatment group) and those who were not (control group).
1. Labeling Treatment and Control Groups
A binary variable ad was added to both datasets:
# Add a variable “ad” to cg_ad_random and set its value to 1 for all rowscg_ad_random["ad"] =1cg_ad_random.head()# Add a variable “ad” to cg_organic_control and set its value to 0 for all rowscg_organic_control["ad"] =0cg_organic_control.head()
converted
GameLevel
NumGameDays
NumGameDays4Plus
NumInGameMessagesSent
NumSpaceHeroBadges
NumFriendRequestIgnored
NumFriends
AcquiredSpaceship
AcquiredIonWeapon
...
TimesKilled
TimesCaptain
TimesNavigator
PurchasedCoinPackSmall
PurchasedCoinPackLarge
NumAdsClicked
DaysUser
UserConsole
UserHasOldOS
ad
0
no
7
18
0
124
0
81
0
yes
no
...
0
0
4
no
yes
3
2101
no
no
0
1
no
10
3
2
60
0
18
479
no
no
...
7
0
0
yes
no
7
1644
yes
no
0
2
no
2
1
0
0
0
0
0
no
no
...
0
0
2
no
no
8
3197
yes
yes
0
3
no
2
11
1
125
0
73
217
no
no
...
0
0
0
yes
no
6
913
no
no
0
4
no
8
15
0
0
0
6
51
yes
no
...
0
2
1
yes
no
21
2009
yes
no
0
5 rows × 21 columns
2. Combining the Datasets
Both groups were stacked vertically into one dataset:
# Create a stacked dataset for the uplift analysis by combining cg_organic_control(Group 1) and cg_ad_random (Group 2). Use cg_rct_stacked as the name for the stacked dataset.cg_rct_stacked = pd.concat([cg_organic_control, cg_ad_random], axis=0).reset_index(drop=True)cg_rct_stacked.head()
converted
GameLevel
NumGameDays
NumGameDays4Plus
NumInGameMessagesSent
NumSpaceHeroBadges
NumFriendRequestIgnored
NumFriends
AcquiredSpaceship
AcquiredIonWeapon
...
TimesKilled
TimesCaptain
TimesNavigator
PurchasedCoinPackSmall
PurchasedCoinPackLarge
NumAdsClicked
DaysUser
UserConsole
UserHasOldOS
ad
0
no
7
18
0
124
0
81
0
yes
no
...
0
0
4
no
yes
3
2101
no
no
0
1
no
10
3
2
60
0
18
479
no
no
...
7
0
0
yes
no
7
1644
yes
no
0
2
no
2
1
0
0
0
0
0
no
no
...
0
0
2
no
no
8
3197
yes
yes
0
3
no
2
11
1
125
0
73
217
no
no
...
0
0
0
yes
no
6
913
no
no
0
4
no
8
15
0
0
0
6
51
yes
no
...
0
2
1
yes
no
21
2009
yes
no
0
5 rows × 21 columns
This creates a single modeling framework where each observation contains:
the treatment indicator ad
the target variable converted
user-level telemetry features (e.g., game activity, purchases, messages, etc.)
3. Creating Training and Test Splits
A new variable training was generated using stratified sampling by both converted and ad:
# Create a training variable (70% training and 30% test). Use 1234 as the seed. Use “converted” and “ad” as the blocking variables, in that order.cg_rct_stacked["training"] = rsm.model.make_train( data = cg_rct_stacked, test_size =0.3, strat_var=["converted", "ad"], random_state=1234)cg_rct_stacked.head()
converted
GameLevel
NumGameDays
NumGameDays4Plus
NumInGameMessagesSent
NumSpaceHeroBadges
NumFriendRequestIgnored
NumFriends
AcquiredSpaceship
AcquiredIonWeapon
...
TimesCaptain
TimesNavigator
PurchasedCoinPackSmall
PurchasedCoinPackLarge
NumAdsClicked
DaysUser
UserConsole
UserHasOldOS
ad
training
0
no
7
18
0
124
0
81
0
yes
no
...
0
4
no
yes
3
2101
no
no
0
1.0
1
no
10
3
2
60
0
18
479
no
no
...
0
0
yes
no
7
1644
yes
no
0
1.0
2
no
2
1
0
0
0
0
0
no
no
...
0
2
no
no
8
3197
yes
yes
0
1.0
3
no
2
11
1
125
0
73
217
no
no
...
0
0
yes
no
6
913
no
no
0
0.0
4
no
8
15
0
0
0
6
51
yes
no
...
2
1
yes
no
21
2009
yes
no
0
1.0
5 rows × 22 columns
Stratification ensures that treatment/control and conversion distributions remain balanced between training and test sets, preventing sampling bias.
4. Validating Stratification
A cross-tabulation confirmed that conversion rates were balanced between the training and test sets within both groups:
# Check if the probability of yes/no is similar across the training and test sets for ad ==0 and ad == 1.pd.crosstab(cg_rct_stacked.converted, [cg_rct_stacked.ad, cg_rct_stacked.training],normalize="columns").round(2)
ad
0
1
training
0.0
1.0
0.0
1.0
converted
yes
0.06
0.06
0.13
0.13
no
0.94
0.94
0.87
0.87
Logistic Regression Uplift Model
To estimate the causal effect of advertising on conversion, two logistic regression models were trained separately for the treatment group (ad = 1) and the control group (ad = 0).
Both models used the same set of explanatory variables derived from in-game telemetry data.
Variables unrelated to player behavior or statistically insignificant in preliminary tests (e.g., TimesKilled, NumFriendRequestIgnored, DaysUser, AcquiredIonWeapon) were excluded to reduce noise and potential multicollinearity.
# remove insignificant variablesfor col in ["TimesKilled", "TimesNavigator","NumInGameMessagesSent","NumFriendRequestIgnored","DaysUser","AcquiredIonWeapon","PurchasedCoinPackSmall","UserConsole"]:if col in evar: evar.remove(col)evar
The treatment model achieved a McFadden pseudo-R² of approximately 0.096 with an AUC of 0.71, while the control model performed slightly better (pseudo-R² ≈ 0.19, AUC ≈ 0.82).
For both models, features such as GameLevel, NumGameDays, NumSpaceHeroBadges, and NumAdsClicked showed strong positive effects on the probability of purchasing the Zalon campaign.
These results indicate that highly engaged players—those with frequent gameplay and in-app activity—are more likely to convert regardless of ad exposure.
Predicted probabilities from both regressions were combined to compute an uplift score, defined as:
[ _i = (Y=1 ad=1, X_i) - (Y=1 ad=0, X_i) ]
This value represents the incremental likelihood of purchase attributable to advertising.
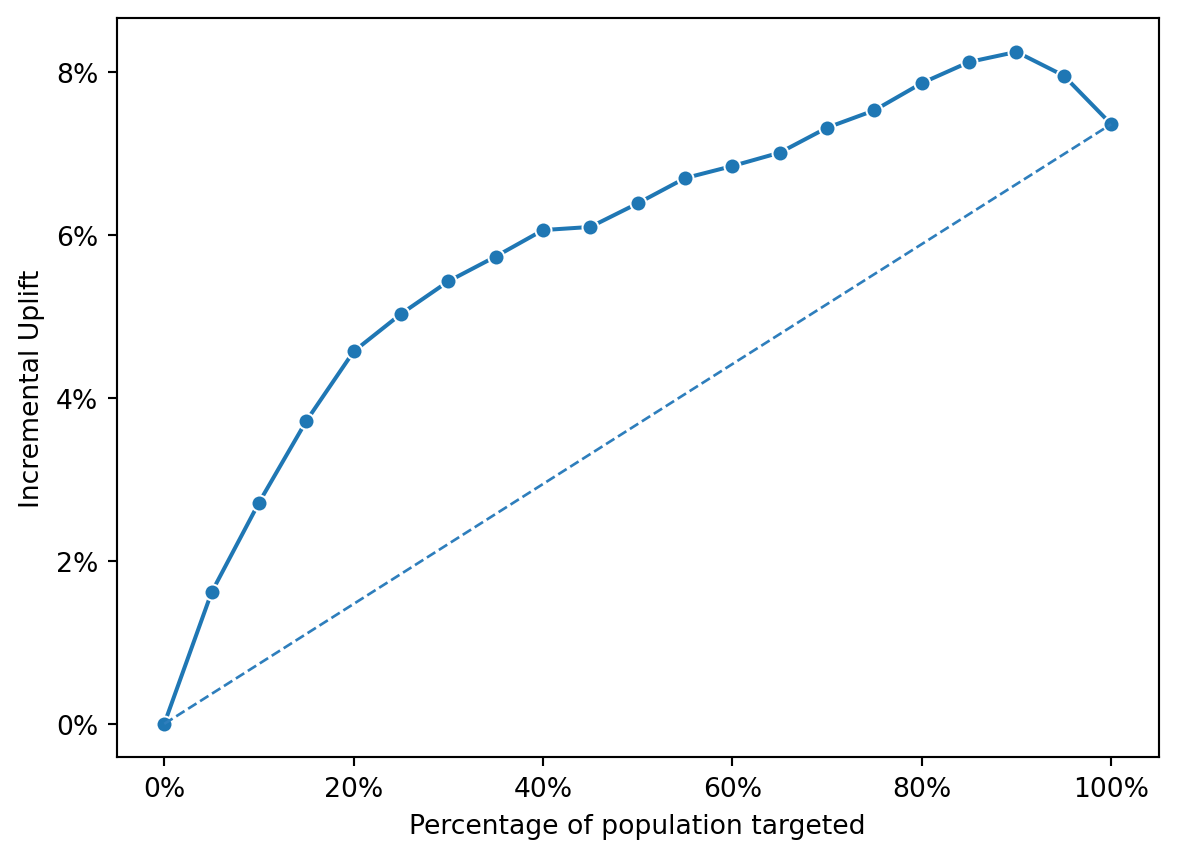
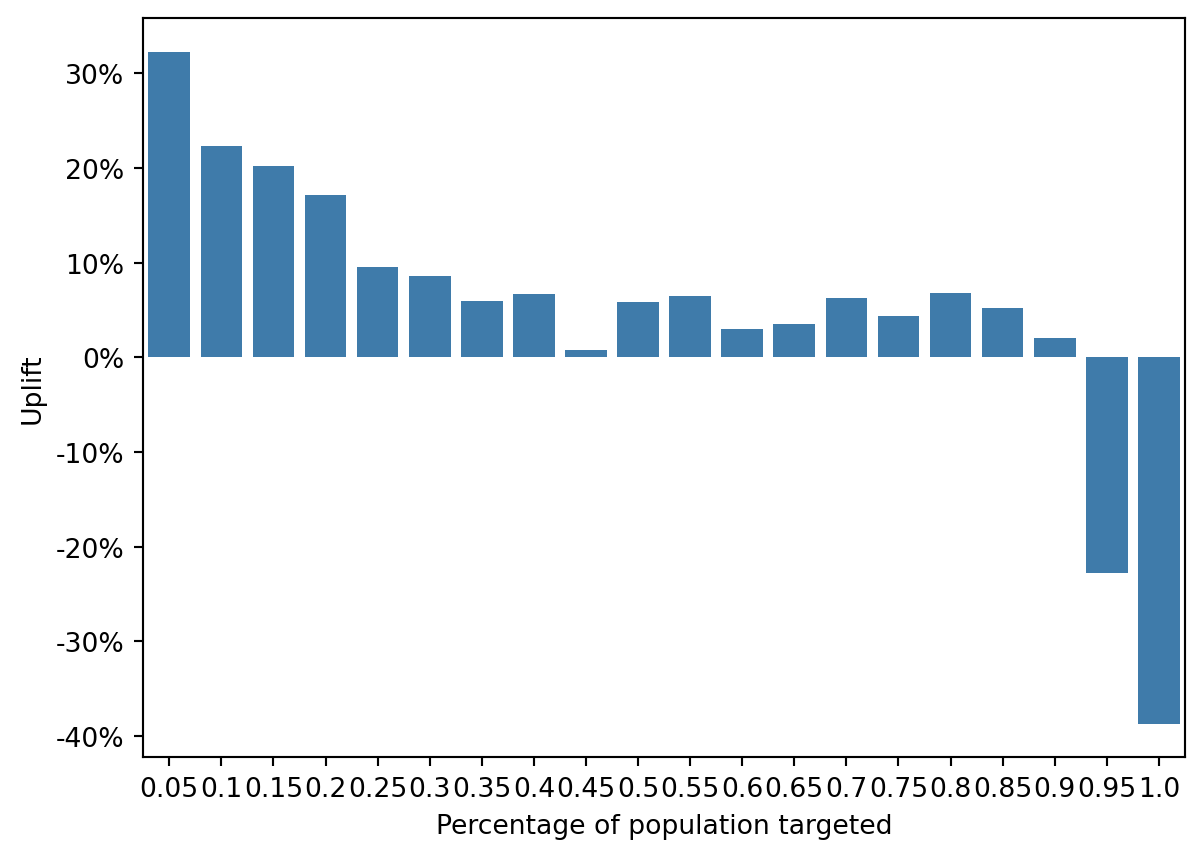
Using the uplift_tab function with 20 quantile bins, the resulting uplift table and incremental uplift plot demonstrated that the model effectively distinguishes between segments positively influenced by ads and those with neutral or negative responses.
The top-scored deciles produced substantial incremental response gains, confirming that logistic regression provides a meaningful baseline for uplift-based targeting before testing more complex models such as Random Forest or XGBoost.
The incremental uplift curve demonstrates that the logistic regression uplift model effectively distinguishes between customers who are positively influenced by advertising and those who are not.
The incremental gain peaks around the top 30–40% of the population, where the additional conversion rate is the highest.
Beyond this range, the curve begins to flatten, indicating diminishing marginal returns from additional targeting.
The uplift distribution plot provides a complementary view: the highest deciles exhibit strong positive uplift, while the lowest segments show negative uplift values.
This implies that targeting low-scoring users could even reduce conversions—highlighting the importance of selective marketing.
Comparison with Propensity Model
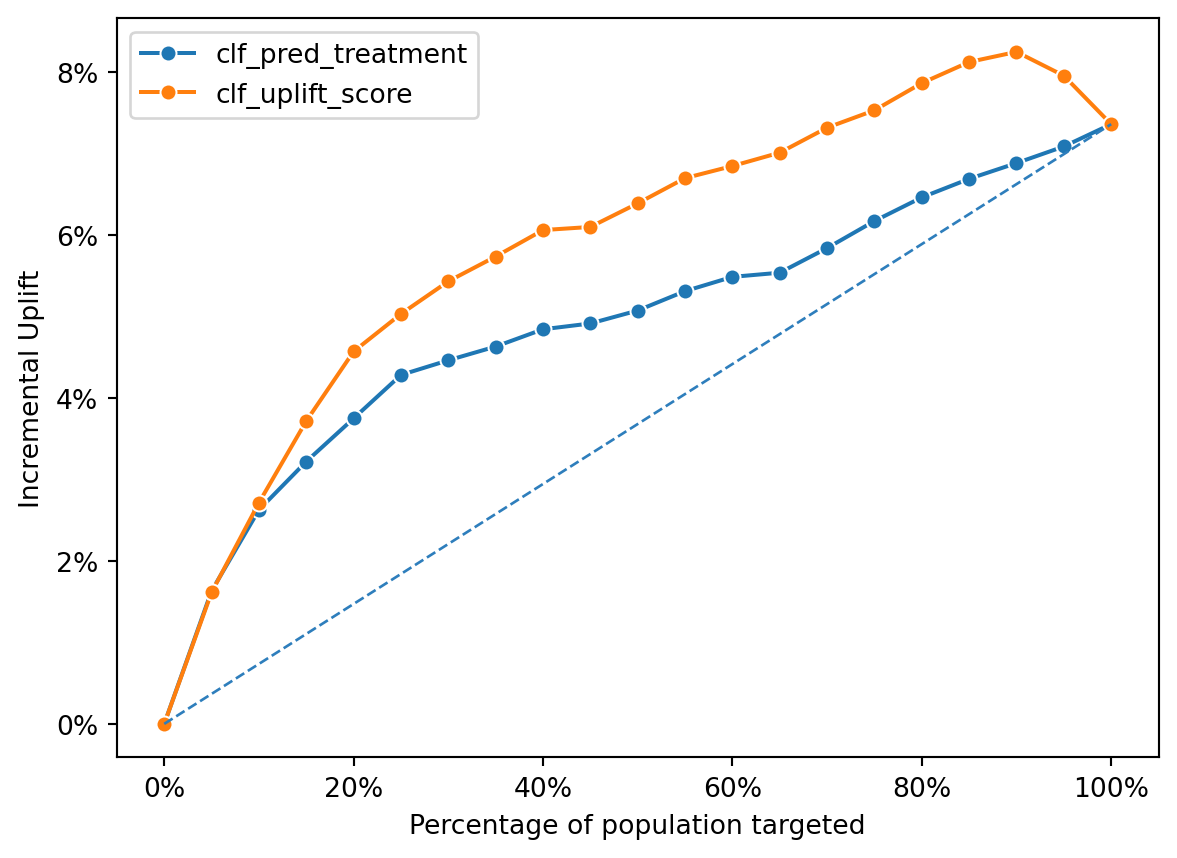
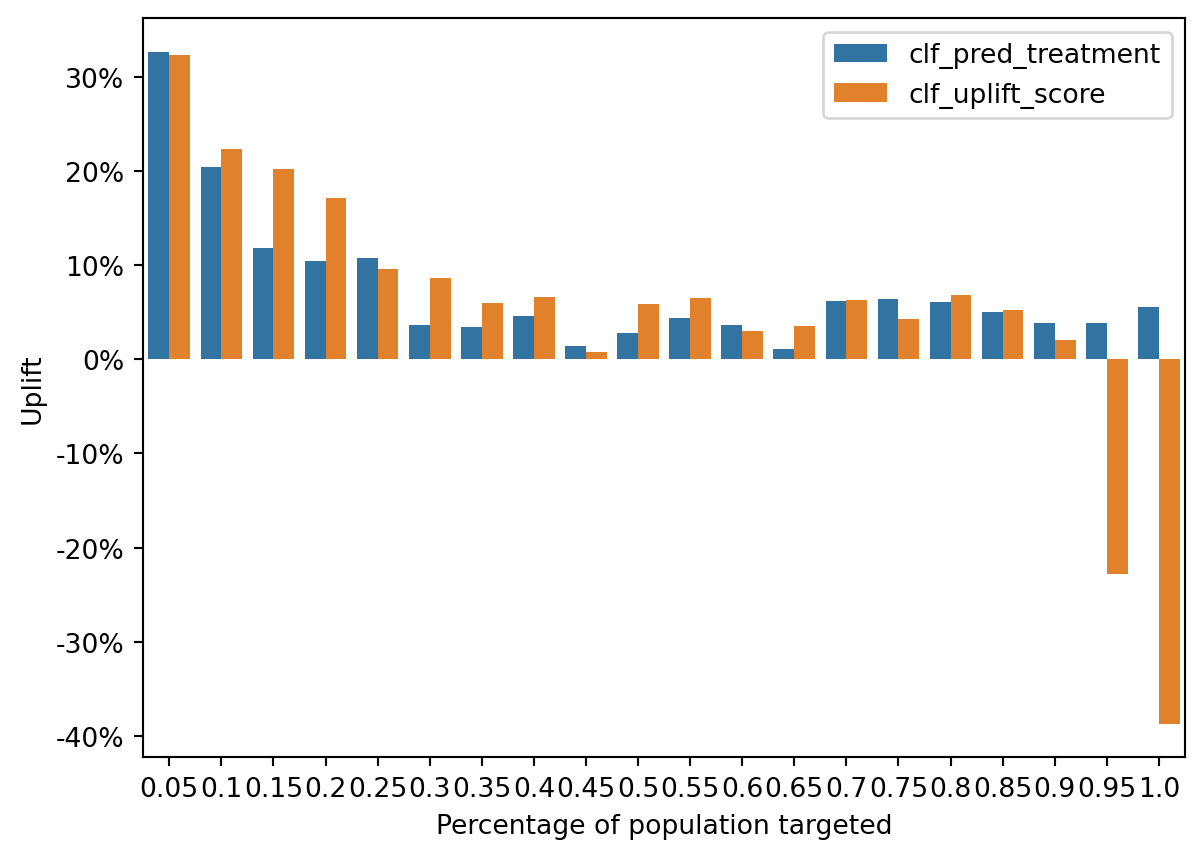
When comparing the uplift and propensity-based approaches, the uplift model (clf_uplift_score) consistently outperforms the propensity model (clf_pred_treatment) across nearly all quantile bins.
As seen in the incremental uplift plot, the uplift curve lies above the propensity curve, achieving higher incremental gains for the same proportion of targeted customers.
This shows that the uplift model better identifies causally responsive segments, rather than simply those with high baseline purchase probabilities.
The uplift bar chart further confirms this pattern: although both models capture high-value customers, the uplift model more effectively isolates the truly persuadable users who convert because of the ad.
This distinction is key for efficient campaign allocation.
Profitability Analysis
Based on the extrapolation to a total audience of 120,000 customers, targeting the top 25% (≈30,000 users) using the uplift model yields approximately $45,443 in additional profit compared to no targeting.
When comparing against the propensity-based targeting strategy, the uplift model delivers an estimated $13,457.75 higher incremental profit under the same budget assumptions.
clf_propensity_tab = rsm.uplift_tab( pred_store.query("training == 0"),"converted","yes","clf_pred_treatment","ad",1, qnt =20,)clf_propensity_tabclf_propensity_incremental = clf_propensity_tab[clf_propensity_tab["cum_prop"] == perc]["incremental_resp"].item()clf_extra_profit_propensity = (clf_incremental-clf_propensity_incremental) * (120000/9000) *14.99print(f"Expect to earn {clf_extra_profit_propensity:.2f} more by using an uplift model rather than a propensity model")
Expect to earn 13457.75 more by using an uplift model rather than a propensity model
These results confirm that the uplift model provides a more effective and profitable targeting framework, ensuring that advertising resources focus on customers who are most likely to respond positively.
Key Takeaways
Uplift modeling captures incremental ad effects rather than overall likelihoods.
Top deciles show the largest positive uplift; targeting beyond 40–50% becomes inefficient.
Negative uplift in the lowest bins warns against indiscriminate ad exposure.
Compared to the propensity model, the uplift model increases both conversion efficiency and incremental profit.
Overall, the logistic uplift model demonstrates clear practical value by maximizing ad ROI and avoiding unnecessary spending on non-responsive users. ## Model Evaluation and Comparison
Uplift Model Performance
The incremental uplift curve demonstrates that the logistic regression uplift model effectively distinguishes between customers who are positively influenced by advertising and those who are not.
The incremental gain peaks around the top 30–40% of the population, where the additional conversion rate is the highest.
Beyond this range, the curve begins to flatten, indicating diminishing marginal returns from additional targeting.
The uplift distribution plot provides a complementary view: the highest deciles exhibit strong positive uplift, while the lowest segments show negative uplift values.
This implies that targeting low-scoring users could even reduce conversions—highlighting the importance of selective marketing.
Comparison with Propensity Model
When comparing the uplift and propensity-based approaches, the uplift model (clf_uplift_score) consistently outperforms the propensity model (clf_pred_treatment) across nearly all quantile bins.
As seen in the incremental uplift plot, the uplift curve lies above the propensity curve, achieving higher incremental gains for the same proportion of targeted customers.
This shows that the uplift model better identifies causally responsive segments, rather than simply those with high baseline purchase probabilities.
The uplift bar chart further confirms this pattern: although both models capture high-value customers, the uplift model more effectively isolates the truly persuadable users who convert because of the ad.
This distinction is key for efficient campaign allocation.
Profitability Analysis
Based on the extrapolation to a total audience of 120,000 customers, targeting the top 25% (≈30,000 users) using the uplift model yields approximately $45,443 in additional profit compared to no targeting.
When comparing against the propensity-based targeting strategy, the uplift model delivers an estimated $13,457.75 higher incremental profit under the same budget assumptions.
These results confirm that the uplift model provides a more effective and profitable targeting framework, ensuring that advertising resources focus on customers who are most likely to respond positively.
Key Takeaways
Uplift modeling captures incremental ad effects rather than overall likelihoods.
Top deciles show the largest positive uplift; targeting beyond 40–50% becomes inefficient.
Negative uplift in the lowest bins warns against indiscriminate ad exposure.
Compared to the propensity model, the uplift model increases both conversion efficiency and incremental profit.
Overall, the logistic uplift model demonstrates clear practical value by maximizing ad ROI and avoiding unnecessary spending on non-responsive users.